


Tour
Every page, shown with a made-up demo lab.
Getting around
The header links to Home, Observations, Discovery, Cluster, Networks, and a Locations menu that lists each location with its areas beneath it. Your name opens Profile, Settings, and Sign out. Below the header, the Sources strip shows internet status and a lamp for each collector source. These docs and the API reference are linked in the footer.
Workspace pages share one layout: a framed view with a compact heading, a breadcrumb, icon tools (hover one for its name), and pill tabs on the right that switch between views of the same place. On a phone, the tools fold into a ☰ menu.
Home
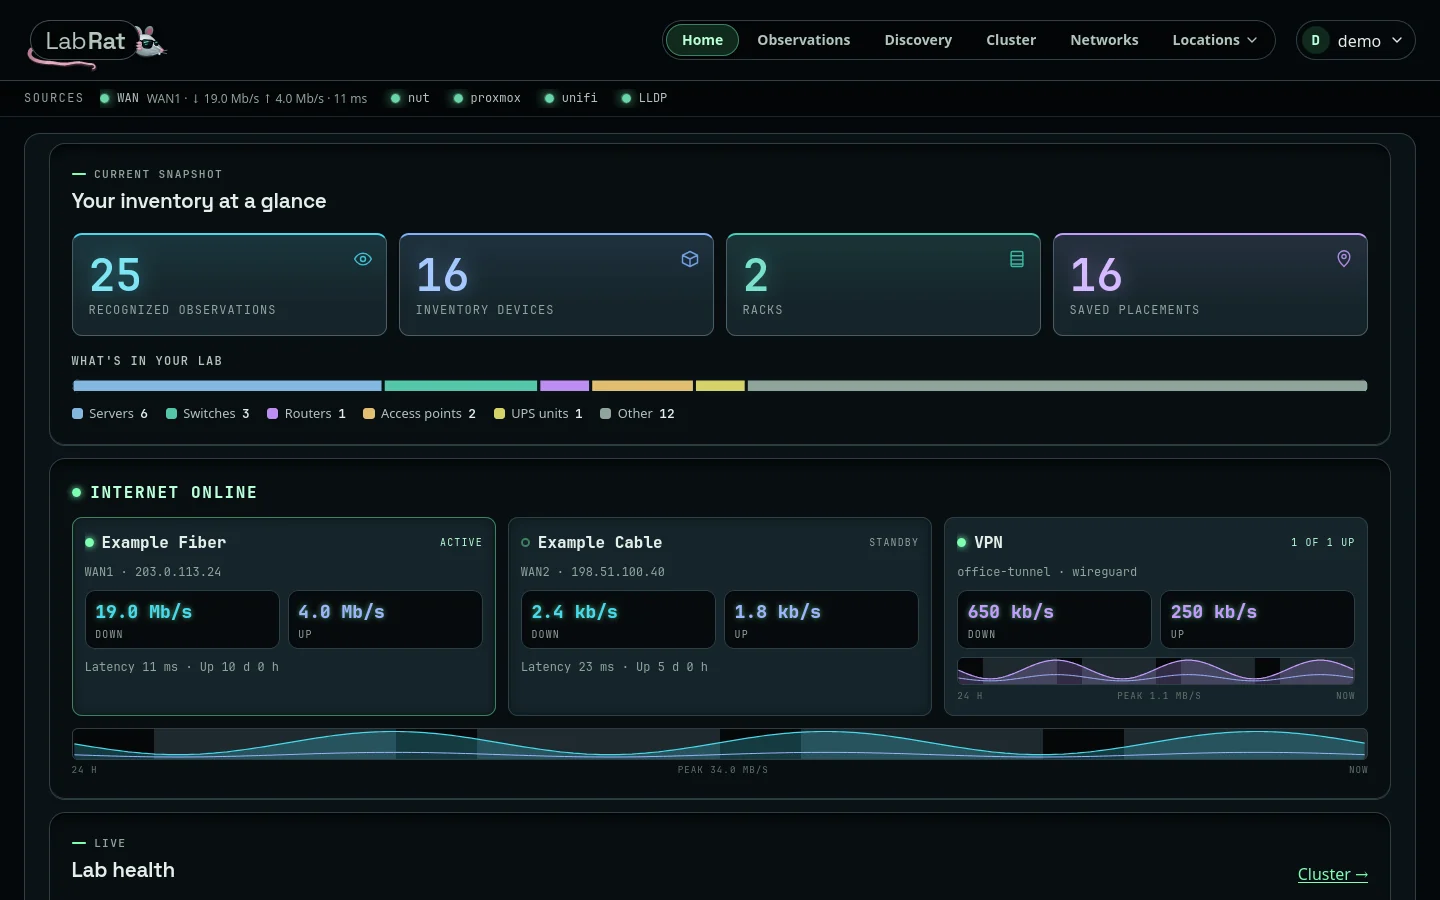
A summary of the cached inventory: counts, a bar of observed equipment by type, each internet connection and VPN tunnel side by side with recent traffic, and, when a Proxmox or UniFi source can feed it, Lab health: live charts of the cluster and the network, with what needs attention. Below are the collector's sources and links back to where you left off.
Observations
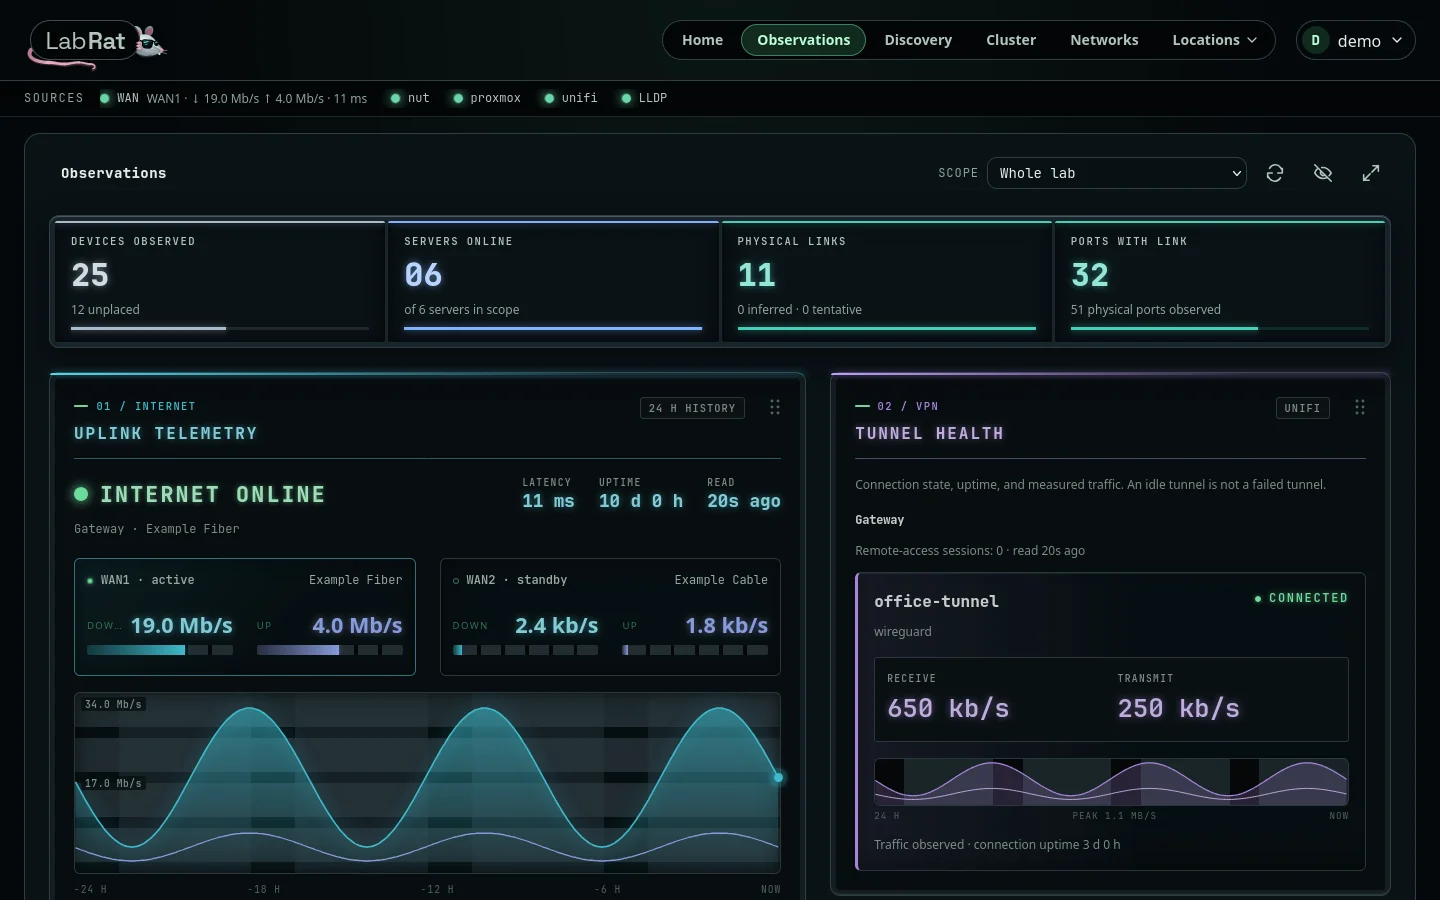
A live operations screen for the whole lab or one area (choose it under Scope; the URL bookmarks it). Panels show internet history, VPN tunnels, server status, UPS power, a watchlist, collector health, port state, and an activity log that starts when you open the page. It rereads the local cache every 15 seconds and never contacts a controller. Stale or unknown readings stay distinct from a confirmed outage, and an idle tunnel is not a failed one.
Select a watchlist condition to see its evidence. Administrators can ignore a condition and bring it back from Ignored items; ignoring changes nothing in collection. Wallboard fills the screen for a dedicated monitor; Escape exits.
Discovery
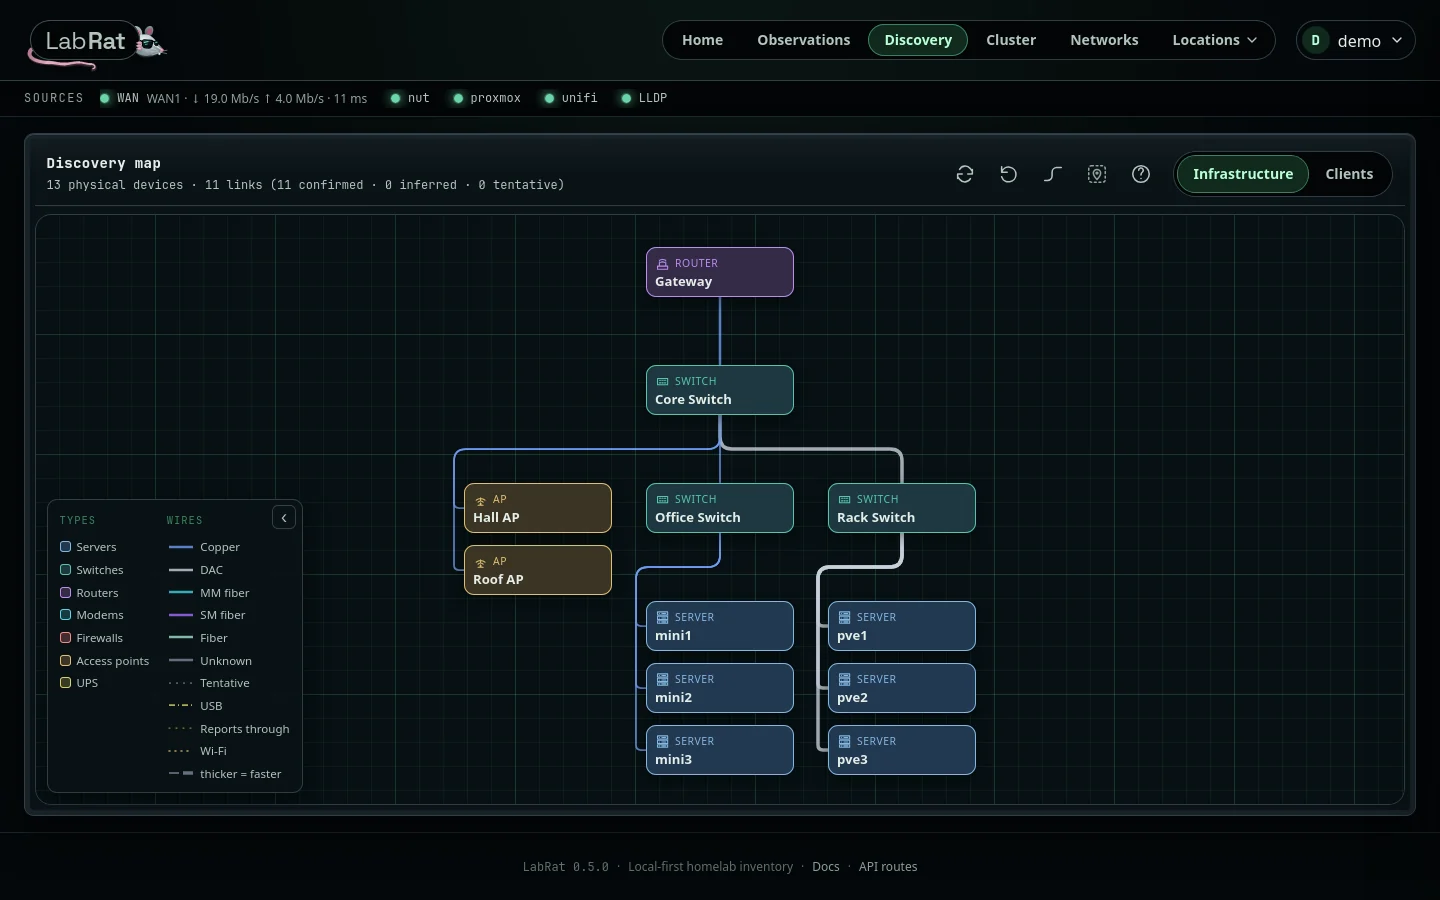
Infrastructure draws recognized physical equipment as a tree: routers at the top, switches by hop, and everything else under what it connects to, with cables styled by medium. Select a device to inspect it and place it. Clients lists wired and Wi-Fi endpoints reported by UniFi, with search, filters, and sortable columns.
Cluster
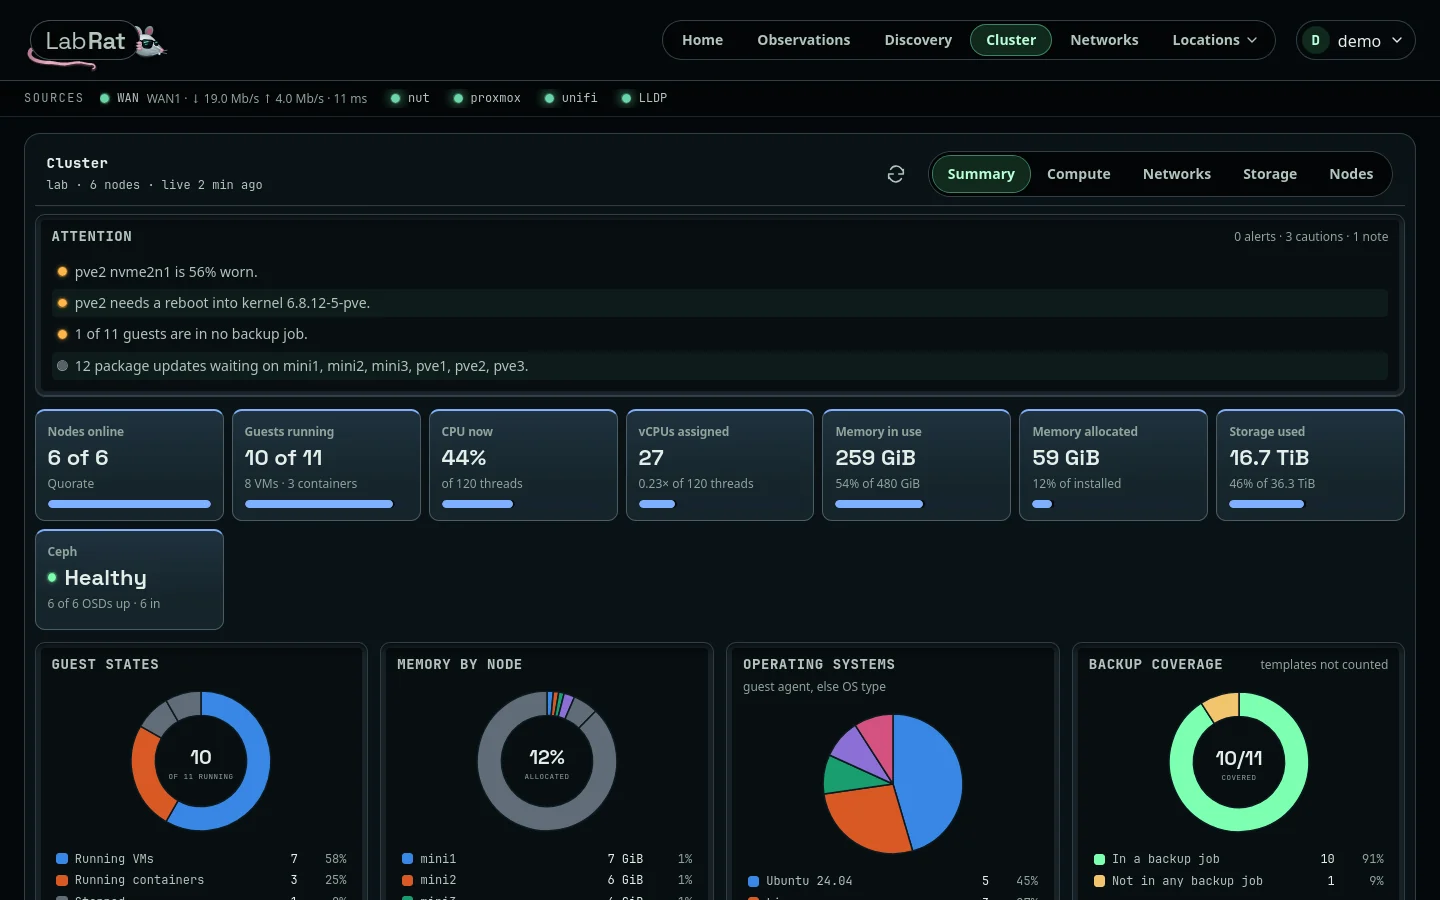
Your Proxmox cluster, read-only. Summary opens with an attention list (worn or hot drives, pending reboots and updates, guests without a backup job), then tiles and charts for nodes, guests, CPU, memory, storage, and Ceph. Compute lists guests as cards, grouped by node or network; Networks shows which nodes carry each bridge and VLAN.
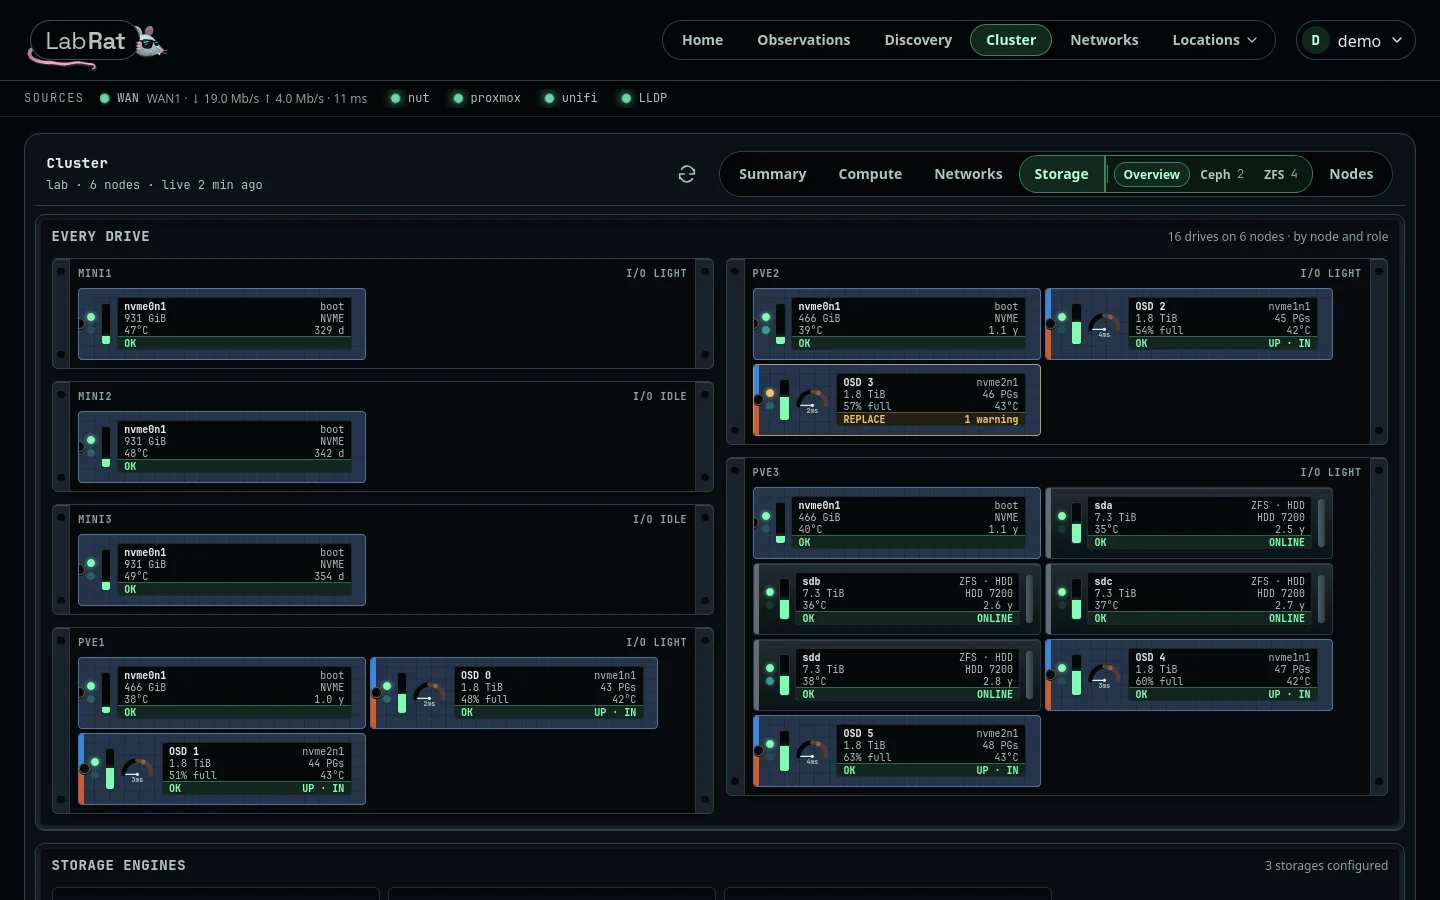
Storage draws every drive as a hot-swap bay, grouped by node and role: a status lamp, a fill bar, temperature, wear, and what it holds (a ZFS pool, a Ceph OSD, or the boot drive), amber only when a drive needs replacing. Switch to a single ZFS pool or Ceph pool for its own shelf, health box, and latency.
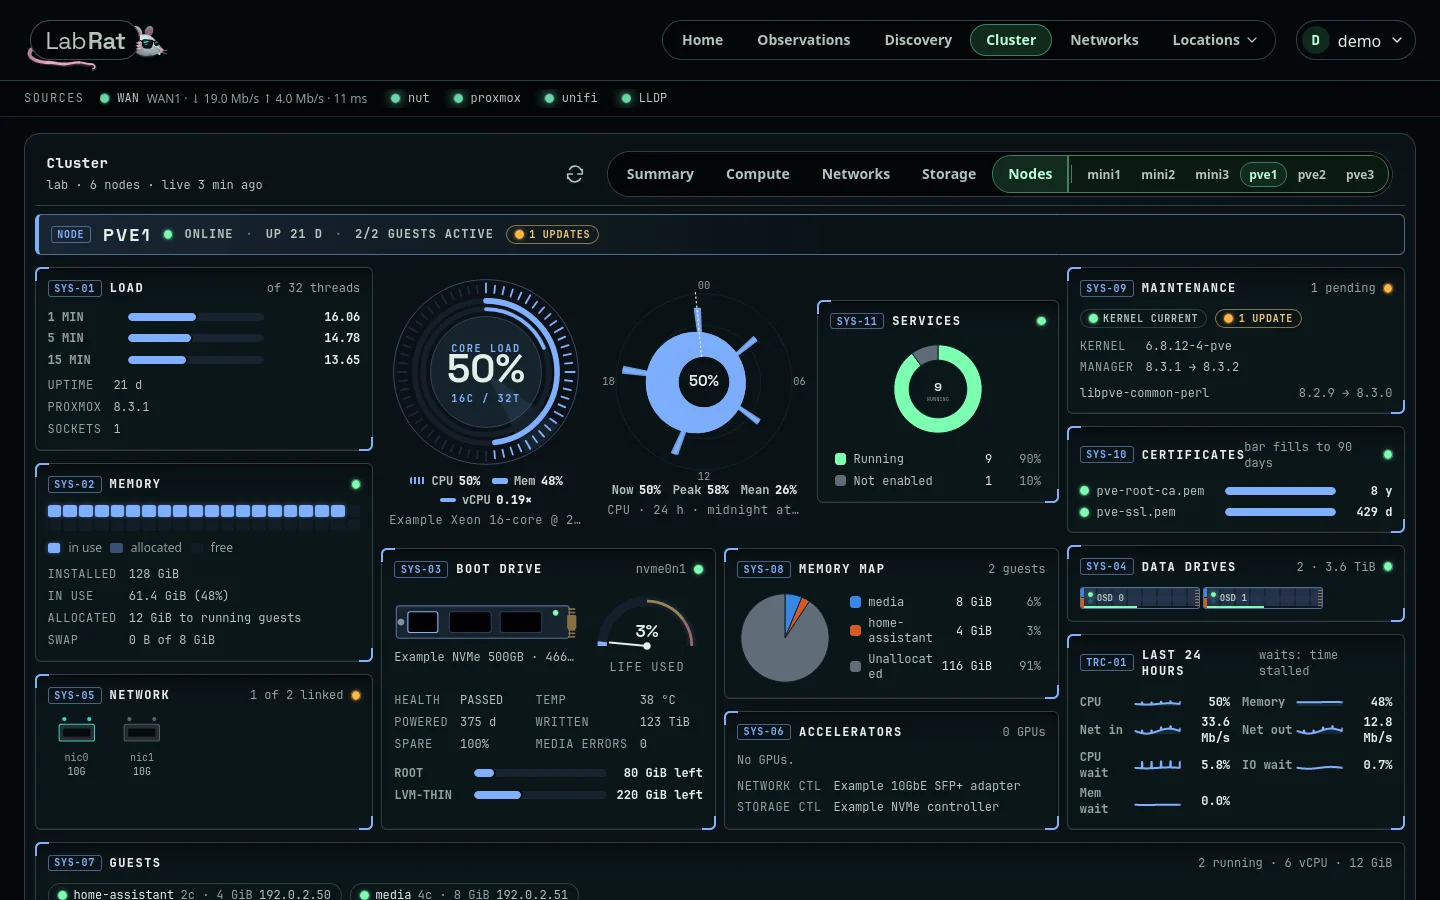
Nodes gives each node one screen: load, memory, network, a core gauge whose sweep turns once per refresh, a 24-hour CPU clock, services, the boot and data drives, the memory map, accelerators, maintenance, certificates, the day's traces, and its guests. While a node is open, its data reloads every 30 seconds.
Networks
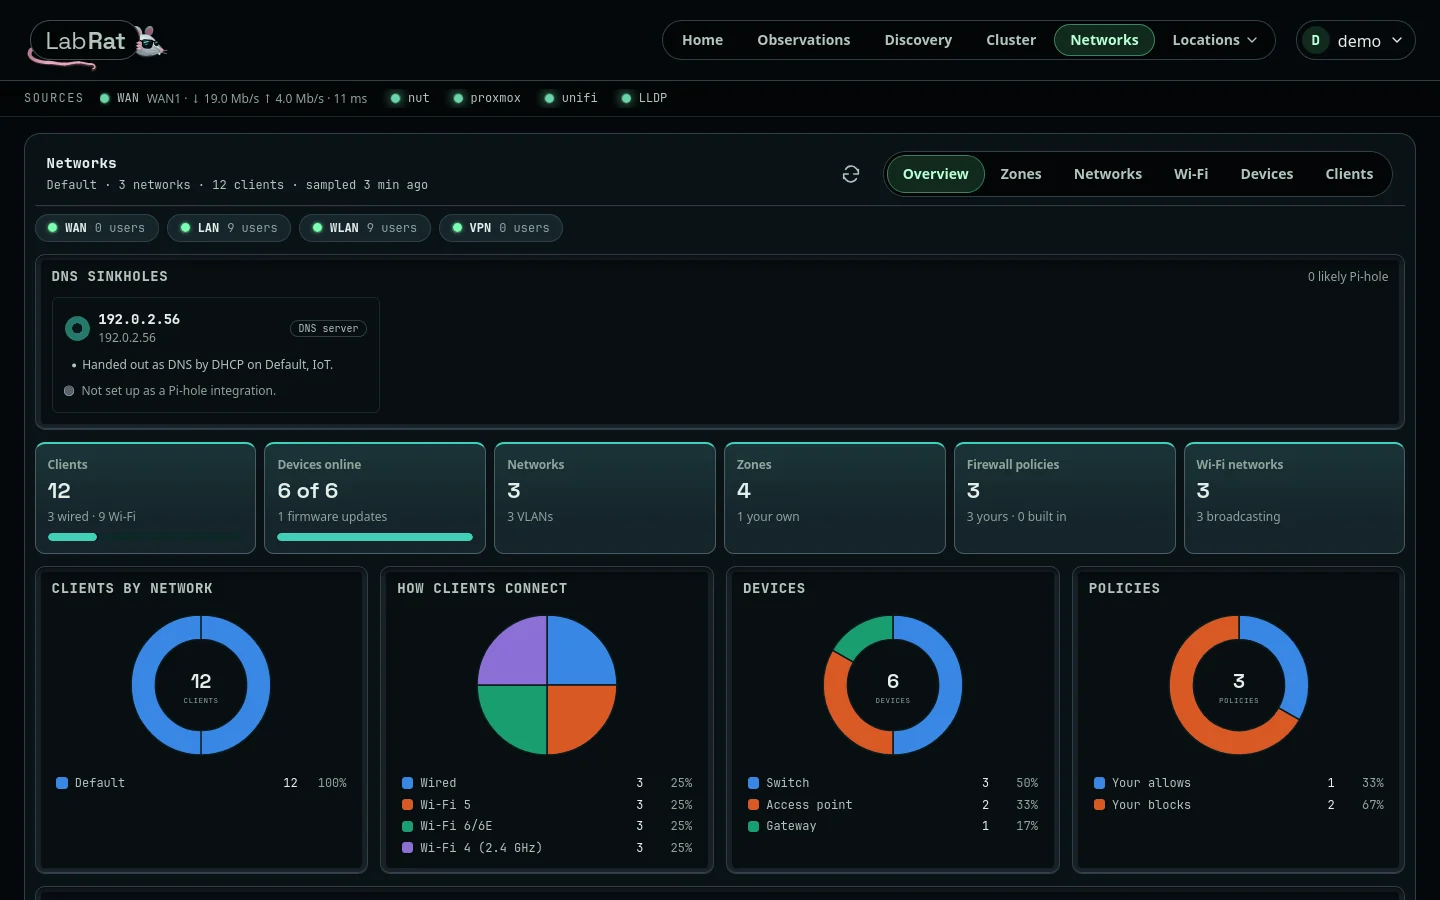
What UniFi knows about your networks: Overview (health, counts, and DNS sinkholes such as Pi-hole), Zones (which firewall zones can reach which, with every exception), Networks (VLANs, subnets, DHCP, and DNS), Wi-Fi (networks, bands, and signal), Devices (the uplink tree, ports, and load), and Clients.
Locations
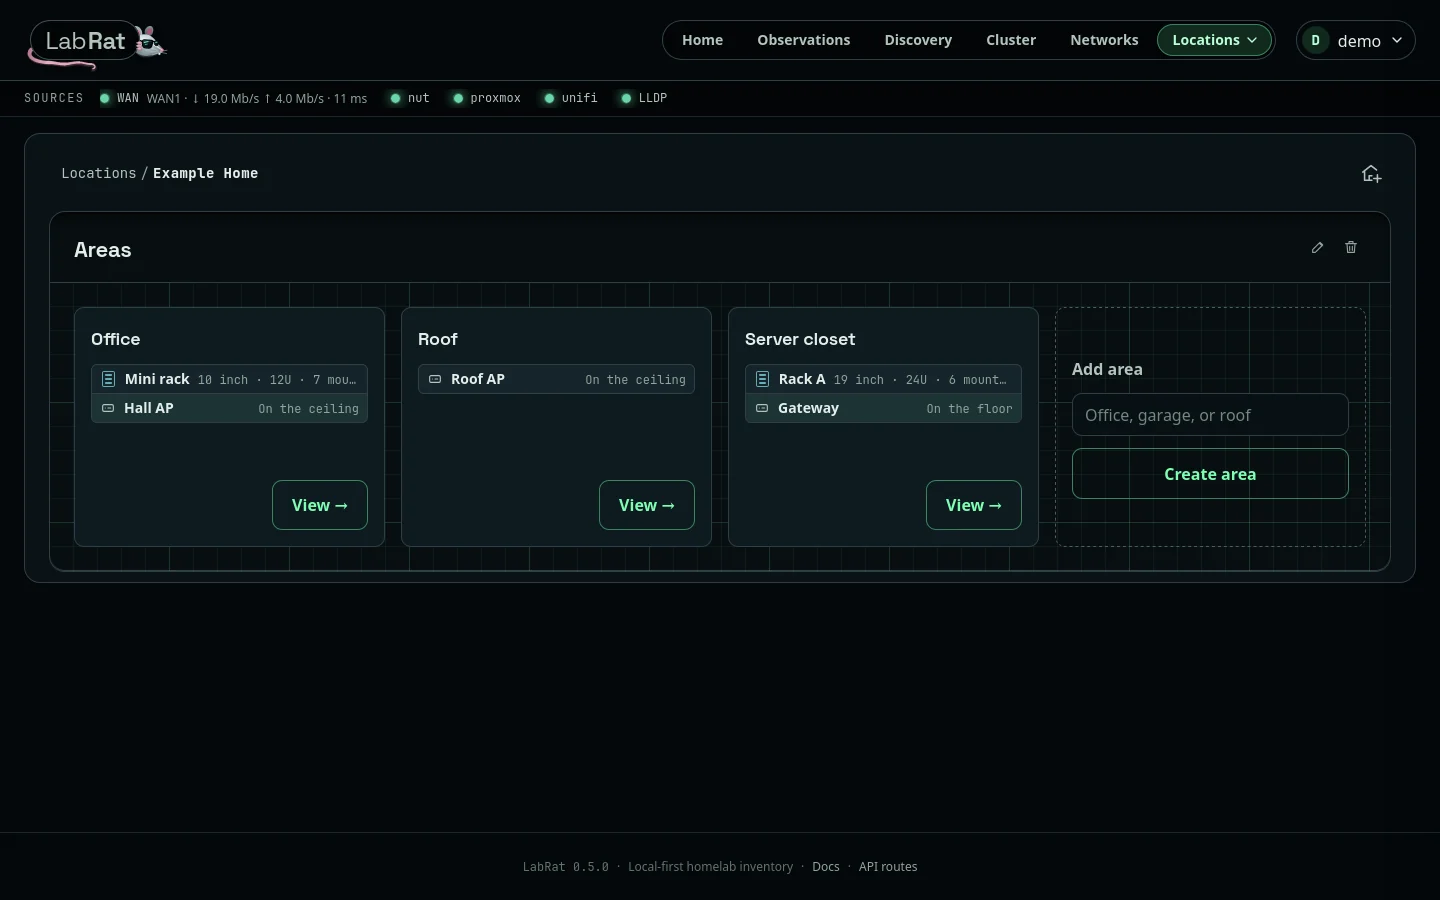
Each location is drawn as a building with its areas. An area card lists what sits at its top level (racks, shelves, and loose devices) and View opens it. Add a location with the tool at the top right, add an area from the last card, and rename or delete a location from its heading. With only one location, LabRat opens it directly.
The Map view, beside Areas in the heading, draws every location on one canvas: each building with its areas, their racks and equipment, and the cables between them, which leave each area through a patch panel on its top edge. Drag to pan, zoom with the wheel or the buttons, use the minimap to move around, and double-click an area to zoom to it. Find lights the devices that match, and Enter moves to the next one.
An area: Floor plan, Equipment, Diagram
An area opens on Equipment when it has racks, otherwise Diagram; the pill tabs switch between all three. The heading's tools edit the area itself (rename or delete), add equipment, and refresh.
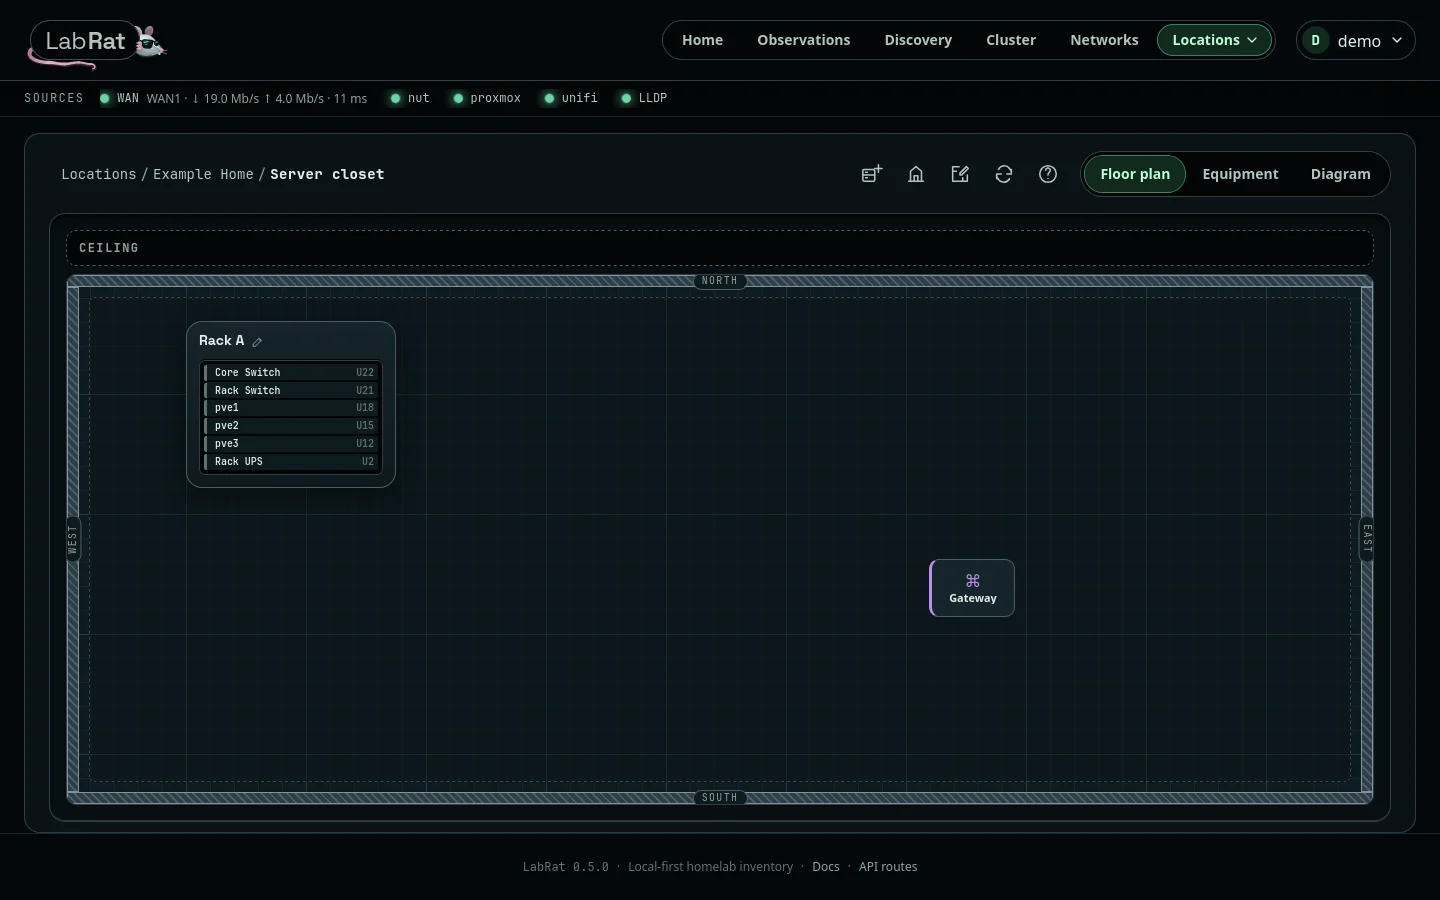
Floor plan is a top-down layout without real dimensions. Drag racks and equipment footprints around the room, against a wall, or onto a shelf. The build-out drawer adds racks, shelves, and surfaces.
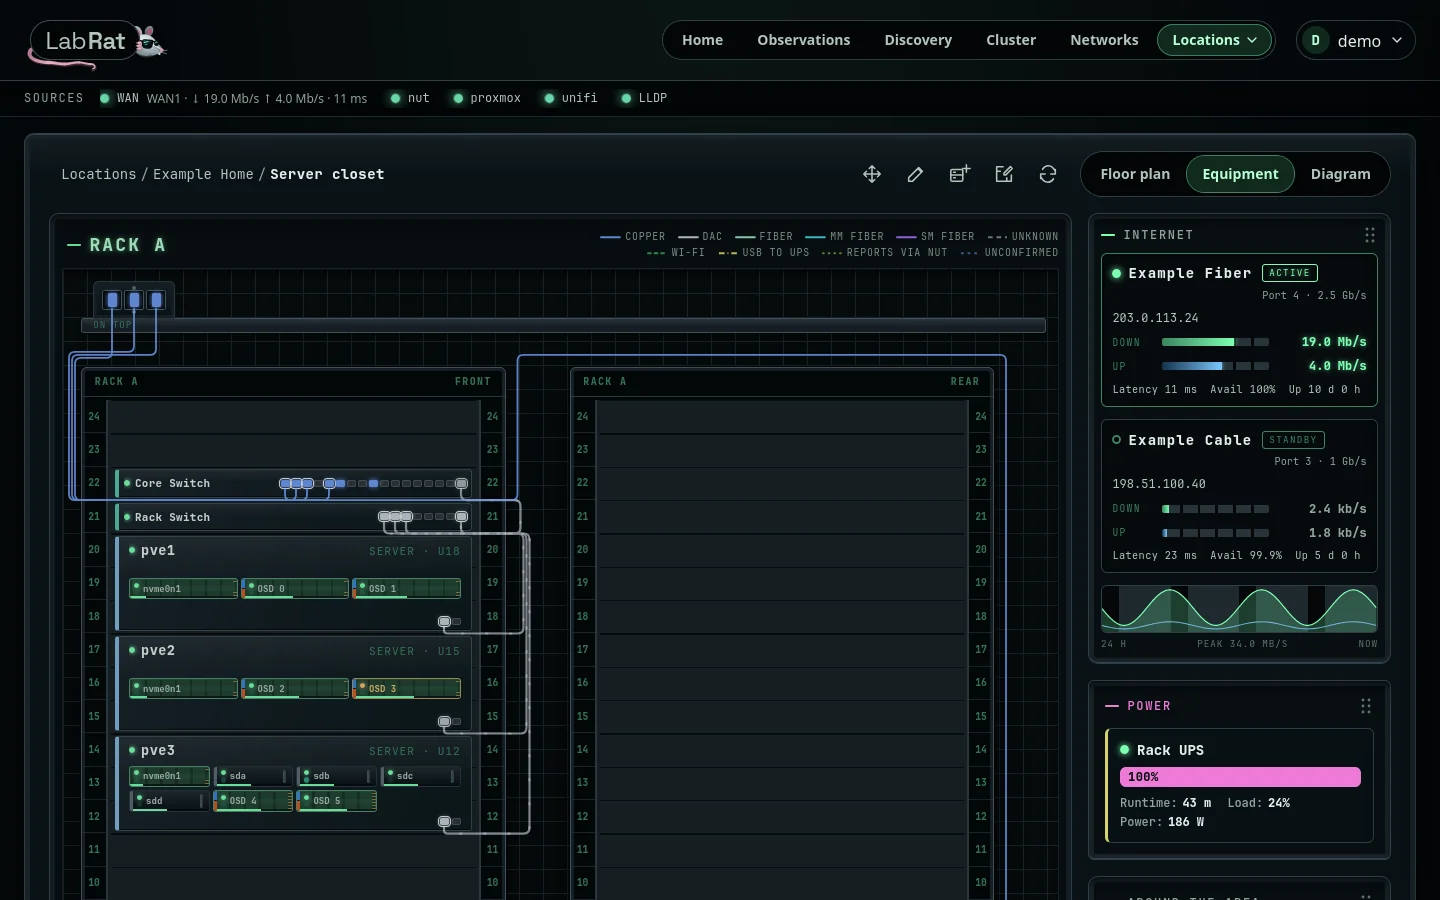
Equipment shows every rack in the area with front and rear elevations, plus the shelves, floor, walls, and ceiling around it. Each device is a faceplate with its port lamps, and cables run between the ports they really use. A server that is a Proxmox node shows its drives on its front as hot-swap bays with health lamps, and its details drawer lists them one per row. Side panels show the area's internet uplinks and UPS power. Arrange mode moves rack equipment by drag and drop or arrow keys and saves every move together.
Racks can be 10 or 19 inches wide, with or without rear access, and every rack is drawn to the same scale. A front-only rack shows one face.
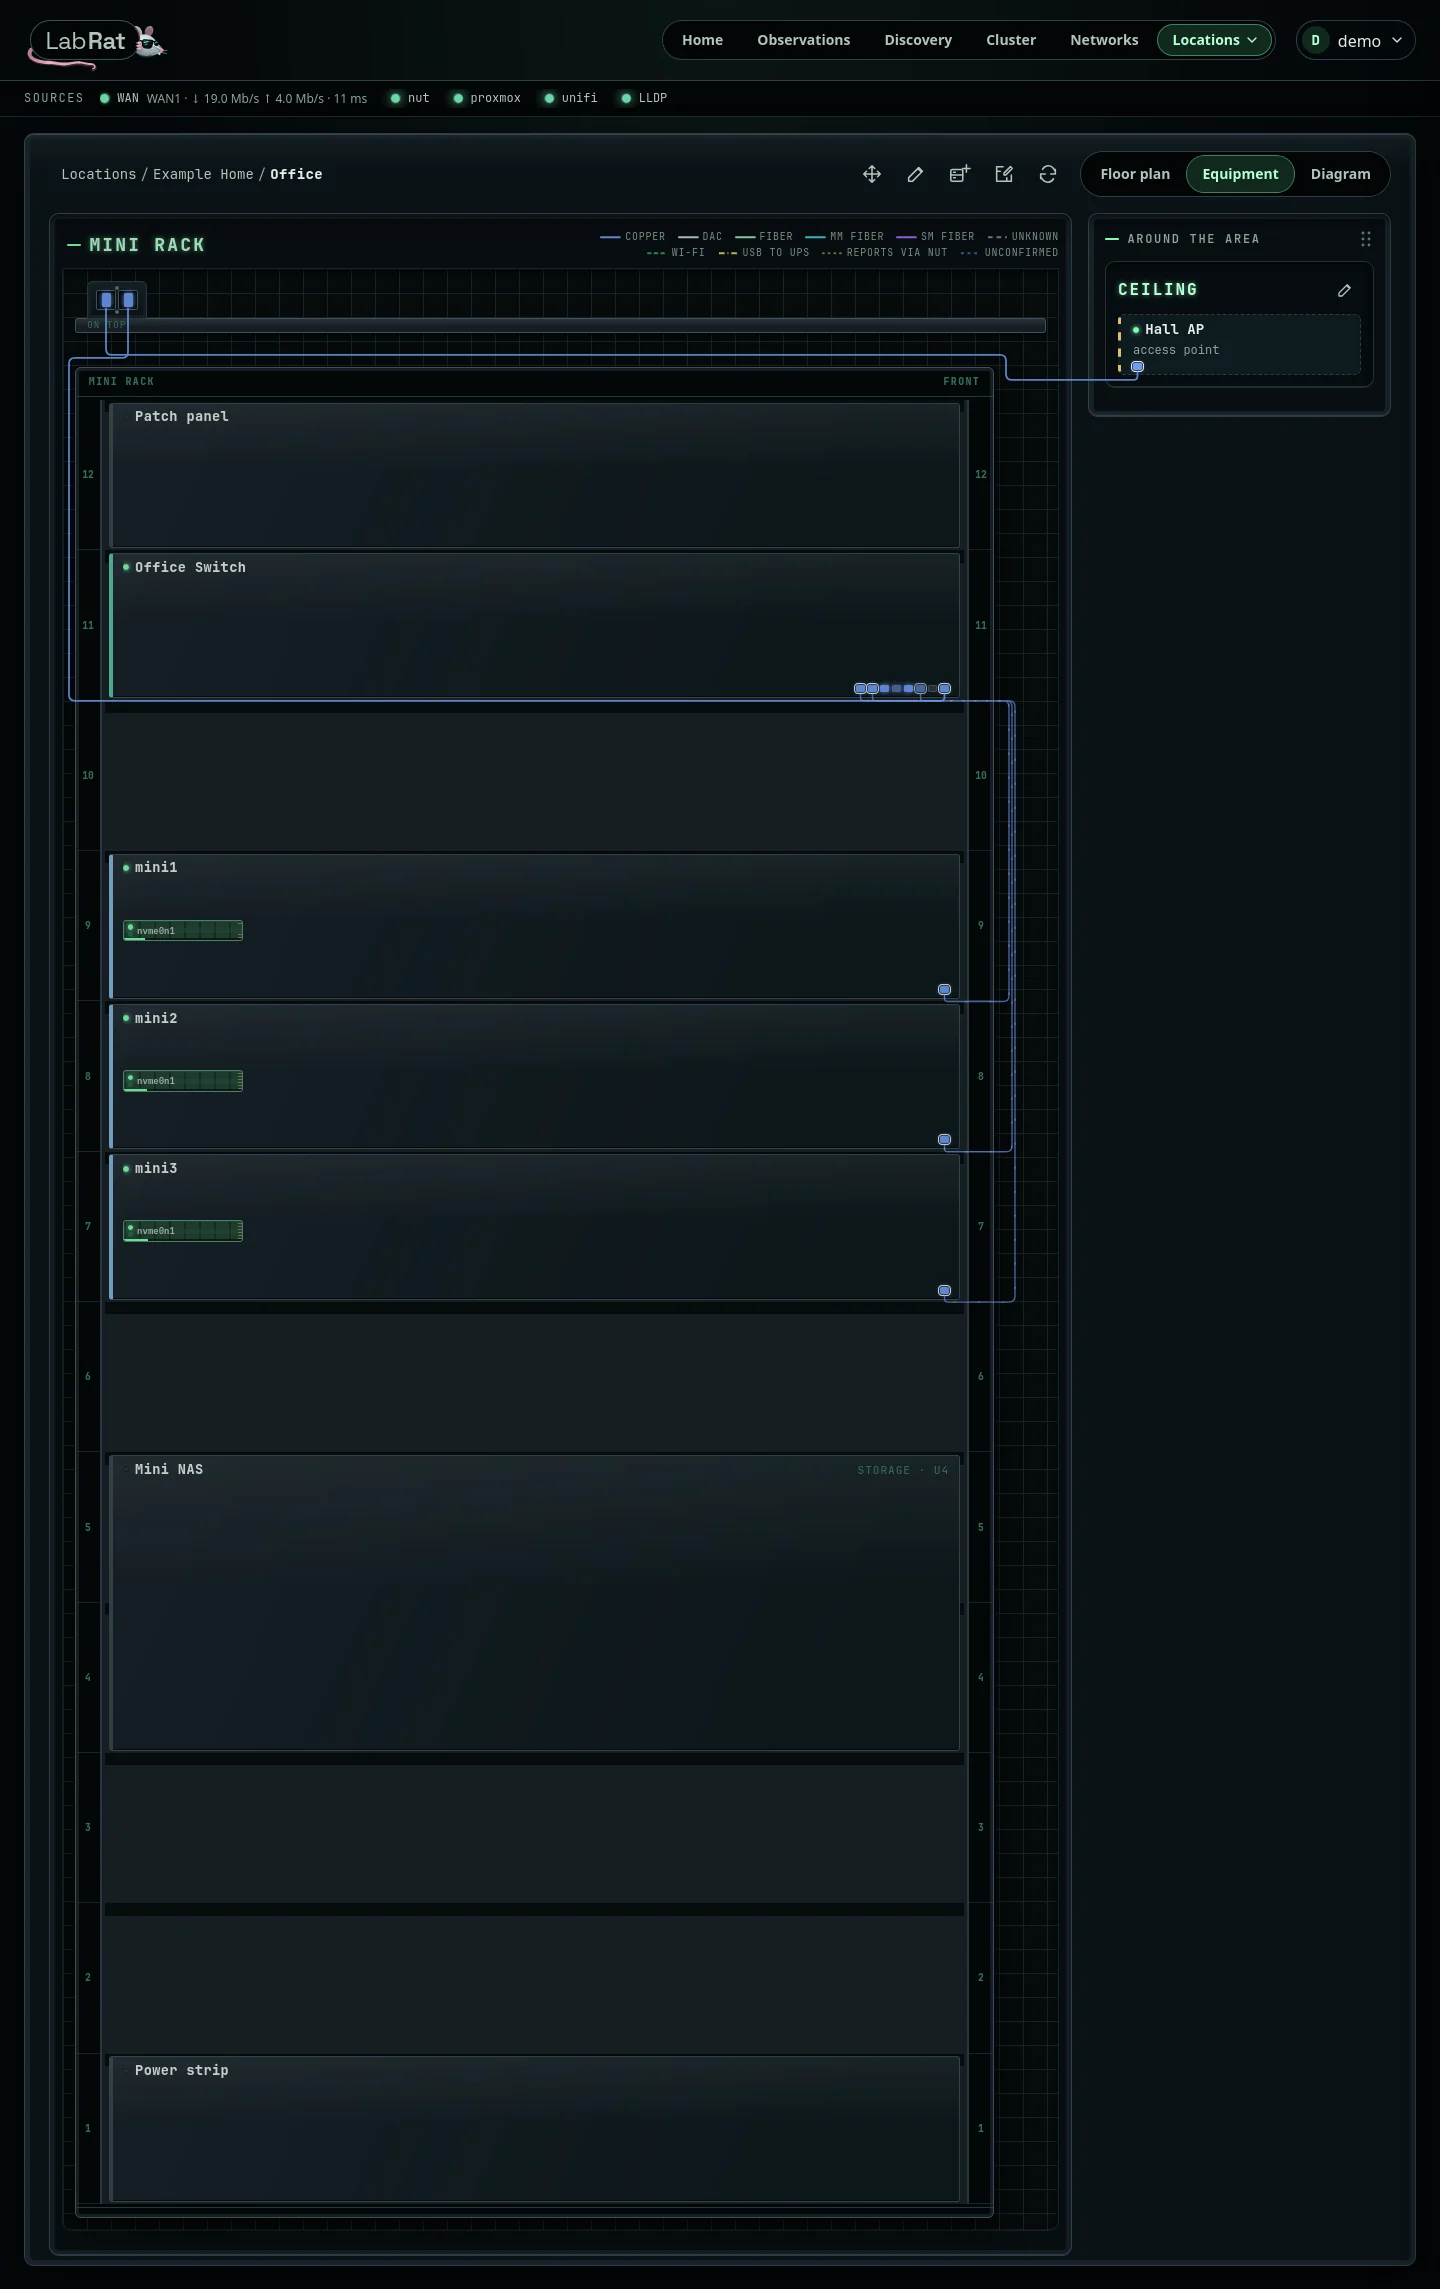
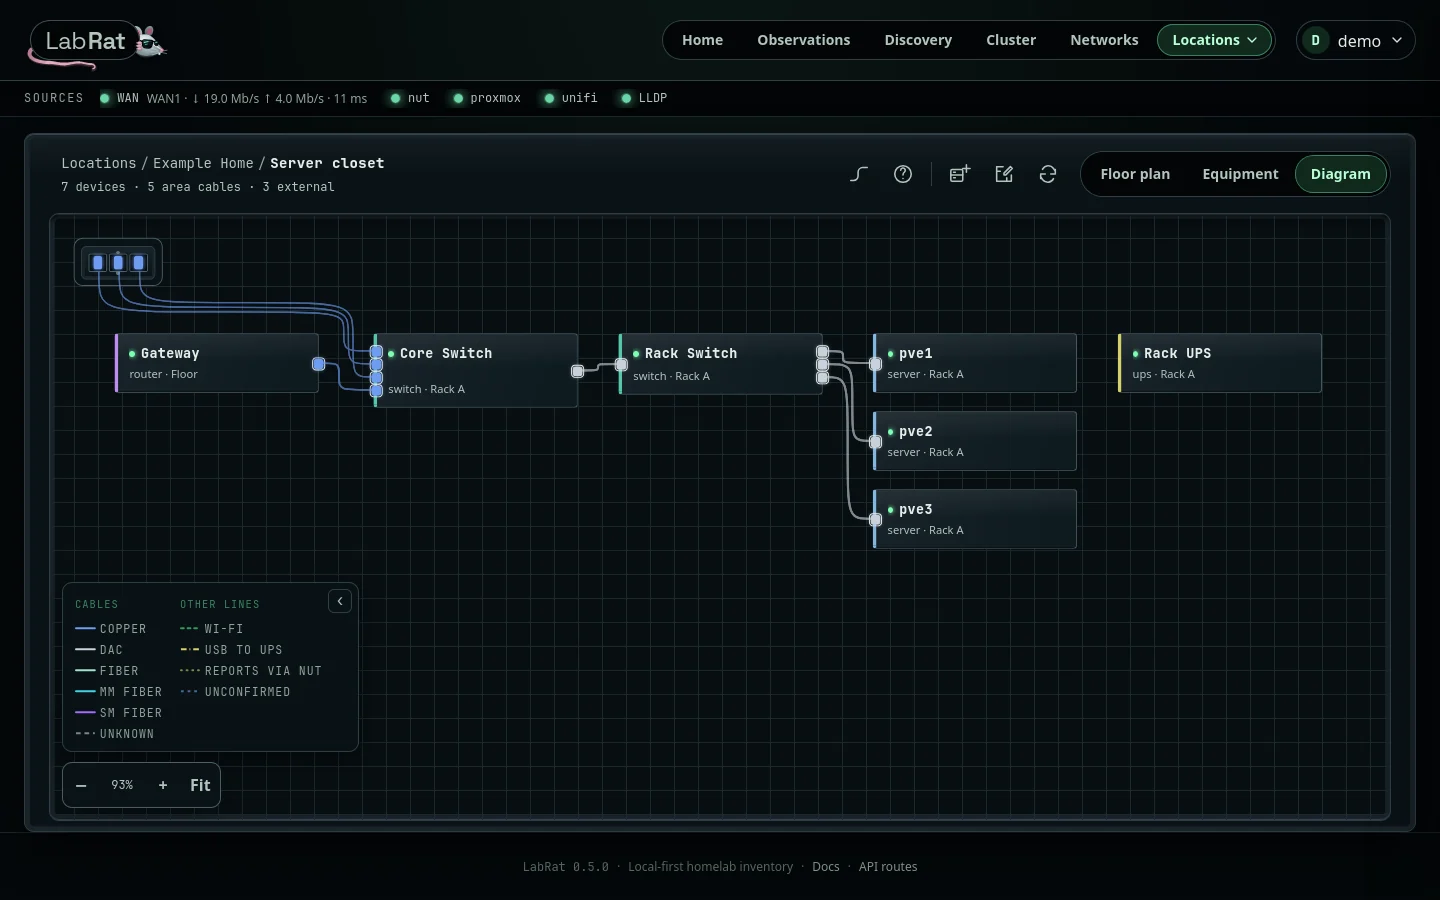
Diagram reads left to right: internet, routers, switches, then what hangs from them, showing only wired ports. Cables leaving the area end on a patch panel along the top; hover a socket for where it goes. Select a device to light its routes to the gateway. Zoom with the wheel or the +/− and Fit buttons, and drag the background to pan.
Settings
Appearance picks a theme for this browser: Disco (the default control-room look), Dark, Light, or Match my system, with an accent color for the calmer themes. Administrators also see Integrations, Discovery, and Export and import, covered step by step in Setup.